


AUD/USD Price Forecast: Australian Dollar slips to two-week low, eyes break below 0.6450
- AUD/USD drops over 0.5% to near 0.6455, its lowest level in two weeks.
- The US Dollar Index (DXY) holds firm near a four-day high around 98.22.
- The Greenback is supported by cautious sentiment ahead of Fed minutes and Jackson Hole Symposium.
The Australian Dollar (AUD) weakens against the US Dollar (USD) on Tuesday, with AUD/USD slipping to its lowest level in two weeks. The pullback comes as the Greenback regains strength ahead of key US macro events, including the release of the Federal Reserve’s (Fed) July meeting minutes on Wednesday and Friday’s Jackson Hole Symposium, prompting cautious repositioning across currency markets.
At the time of writing, the AUD/USD pair is trading near 0.6453, down over 0.5% on the day. Meanwhile, the US Dollar Index (DXY), which measures the Greenback’s performance against a basket of six major currencies, is holding firm near a four-day high around 98.22, underpinned by cautious market sentiment and broad-based Dollar strength.
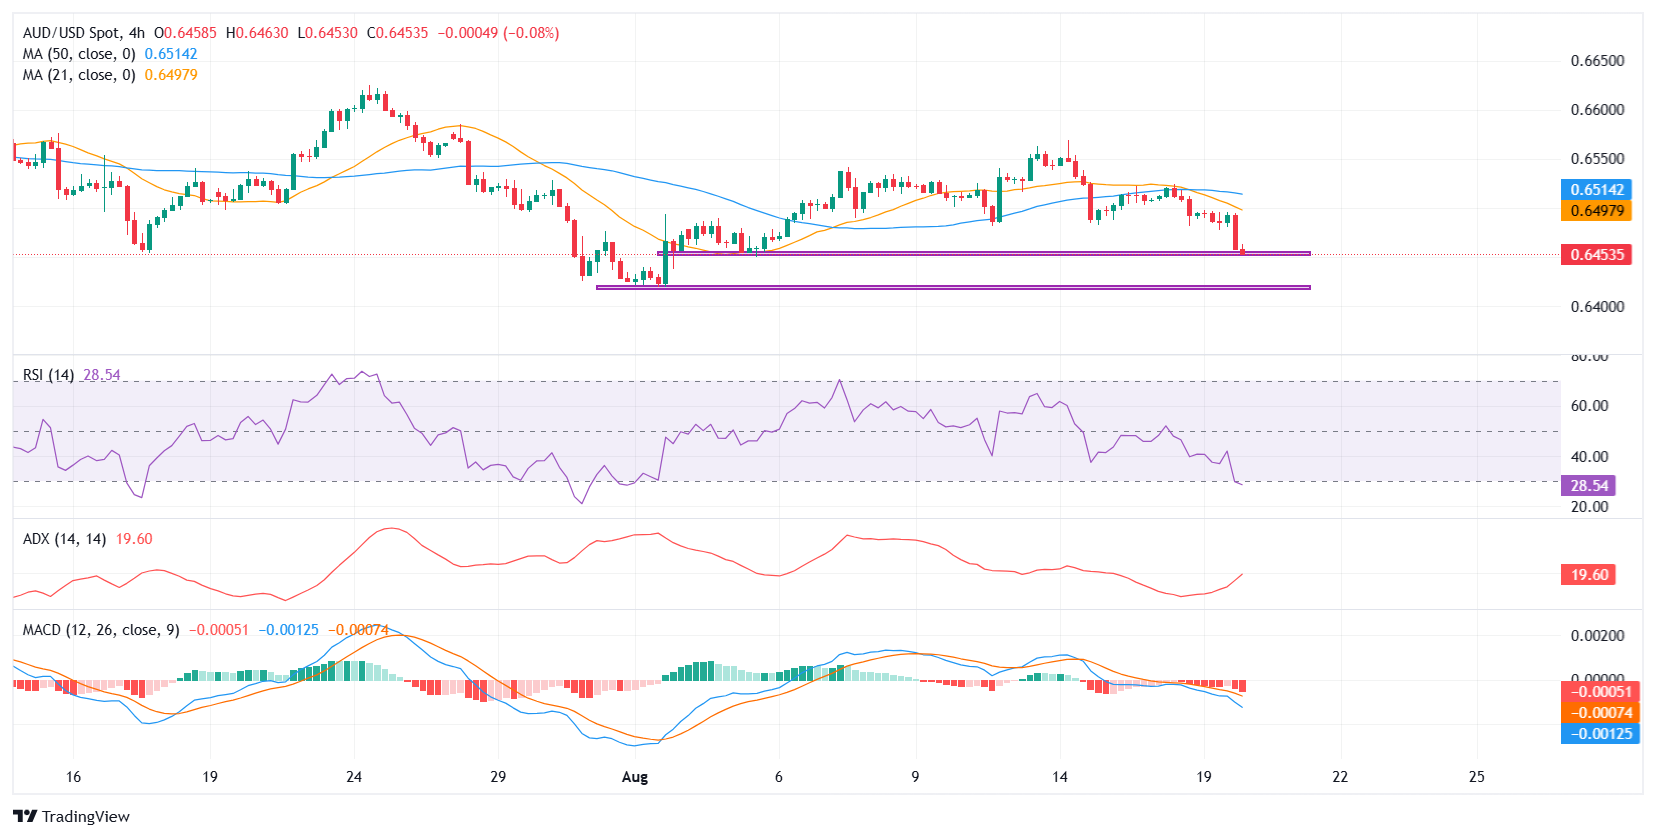
From a technical perspective, AUD/USD is currently testing support near the 0.6450 mark on the 4-hour chart. The pair has been drifting lower since briefly peaking above 0.6550 on August 14, forming a sequence of lower highs and lower lows, indicative of a short-term bearish trend.
A sustained break below 0.6450 would expose the next immediate support at 0.6420, the monthly low from August 1. A failure to hold above this zone could trigger a deeper pullback toward the June low at 0.6385
On the upside, initial resistance is seen near the 21-period Simple Moving Average, currently at 0.6498. This coincides with recent intraday swing highs and could cap any recovery attempts. A break above that would bring the 50-period SMA into focus. However, the 0.6550 level remains the key to shift the broader bias back to neutral, as it marks the August swing high and a strong prior rejection point.
Momentum indicators on the 4-hour chart paint a bearish picture for AUD/USD. The Relative Strength Index (RSI) has dropped to 28.5, slipping firmly into oversold territory. While this suggests selling pressure is elevated, it also raises the risk of a temporary bounce or consolidation, especially if the pair holds above the 0.6450-0.6420 support area.
However, given the prevailing trend of lower highs and lower lows, the oversold reading currently supports continuation rather than reversal. The Moving Average Convergence Divergence (MACD) indicator has shown a fresh bearish crossover, with the histogram turning negative, pointing to strengthening downside momentum, albeit still modest while near the zero line. Meanwhile, the Average Directional Index (ADX) stands at 19.6, indicating that although the trend is not yet strongly directional, bearish strength is beginning to build. A rise above 20 in the coming sessions could further validate the downside momentum.
Economic Indicator
FOMC Minutes
FOMC stands for The Federal Open Market Committee that organizes 8 meetings in a year and reviews economic and financial conditions, determines the appropriate stance of monetary policy and assesses the risks to its long-run goals of price stability and sustainable economic growth. FOMC Minutes are released by the Board of Governors of the Federal Reserve and are a clear guide to the future US interest rate policy.
Next release: Wed Aug 20, 2025 18:00
Frequency: Irregular
Consensus: -
Previous: -
Source: Federal Reserve
Minutes of the Federal Open Market Committee (FOMC) is usually published three weeks after the day of the policy decision. Investors look for clues regarding the policy outlook in this publication alongside the vote split. A bullish tone is likely to provide a boost to the greenback while a dovish stance is seen as USD-negative. It needs to be noted that the market reaction to FOMC Minutes could be delayed as news outlets don’t have access to the publication before the release, unlike the FOMC’s Policy Statement.