


Gold price slides as easing US-Iran tensionsdent haven demand
- US-Iran talks resume after weekend fire near the Strait of Hormuz.
- Warsh’s remarks in Sintra and NFP shape Fed outlook.
- Markets price September hike risk despite softer Dollar.
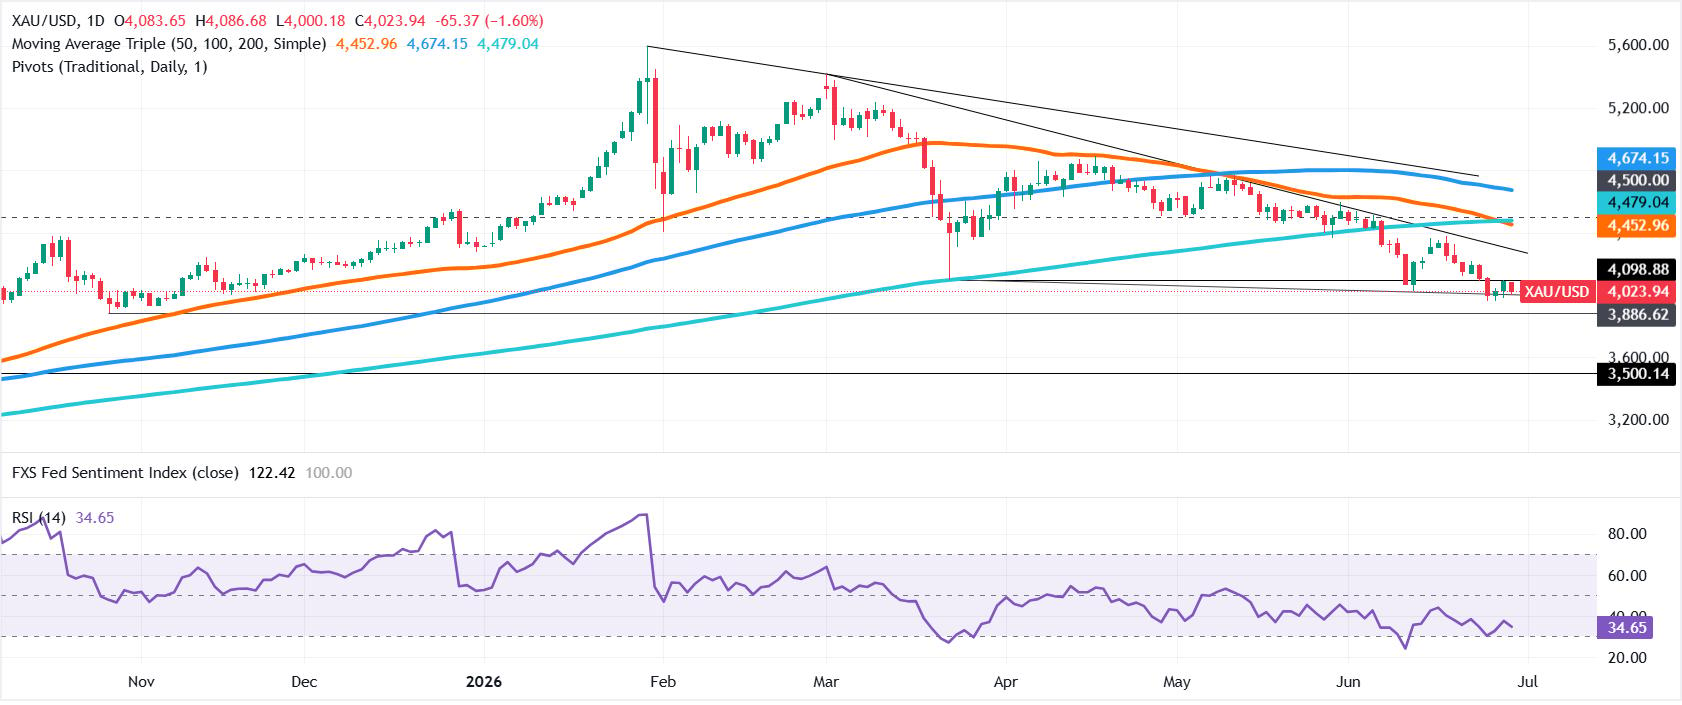
Gold (XAU/USD) price retreats by some 1.50% on Monday as risk appetite improves following the halt of hostilities over the weekend between the US and Iran, which threatened to derail negotiations and Oil flow through the Strait of Hormuz. The XAU/USD pair trades at $4,021 after reaching a daily high of $4,088.
XAU/USD falls as risk appetite improves before key US data
The yellow metal remains on the defensive amid steady US Treasury yields. The US Dollar Index (DXY), which measures the US currency against six other currencies, is down nearly 0.30% to 101.10, while bullion prices seem poised to extend their losses towards $4,000.
Tensions in the Middle East rose as Tehran and Washington exchanged fire near the Strait of Hormuz over the weekend, disrupting shipping routes and putting the peace deal at risk.
In the meantime, talks between the US and Iran are set to resume after a halt in hostilities, a US official said on Sunday.
Aside from this, traders' focus is on the US economic calendar, with the new Fed Chair, Kevin Warsh, set to appear at the European Central Bank (ECB) Sintra Symposium in Portugal. Alongside this, investors await US data, namely Nonfarm Payrolls for June, which are expected to provide some guidance on what the Federal Reserve might do next, given the US central bank's lack of forward guidance.
Other data, such as the ISM Manufacturing PMI, the Job Openings and Labor Turnover Survey (JOLTS), and jobless claims, will update the status of the labor market, which, according to Fed officials, remains solid.
Money markets are pricing in 34 basis points of Fed tightening, with the first rate hike seen in September, with odds standing near 64%, according to Prime Terminal data. For the upcoming July meeting, the Fed is expected to hold rates?.
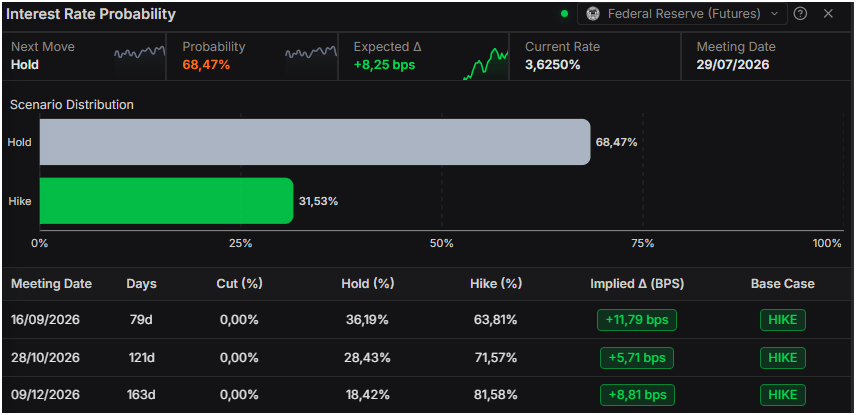
On Tuesday, the US economic schedule will feature the JOLTS report, which is expected to show that vacancies dipped from 7.618 million in April to 7.3 million in May. Other data is expected, such as the Chicago PMI and Consumer Confidence from the Conference Board (CB).
XAU/USD price forecast: Gold erases Friday’s gains, recoils towards $4,000
Gold is forming a bearish harami candlestick pattern after grinding lower from around $4,400, hit in mid-June, towards the year-to-date (YTD) low of $3,959.
The Relative Strength Index (RSI) shows that sellers are in charge and that further downside is likely.
Hence, if XAU/USD clears the $4,000 psychological level, traders would test the June 26 daily low of $3,983. Beneath this level, the next support would be the YTD low, followed by the $3,950 psychological level ahead of $3,900.
Upwards, the first resistance is the June 26 high of $4,096, followed by $4,100. Once hurdled, the next stop would be the June 24 high at $4,115.
Gold FAQs
Gold has played a key role in human’s history as it has been widely used as a store of value and medium of exchange. Currently, apart from its shine and usage for jewelry, the precious metal is widely seen as a safe-haven asset, meaning that it is considered a good investment during turbulent times. Gold is also widely seen as a hedge against inflation and against depreciating currencies as it doesn’t rely on any specific issuer or government.
Central banks are the biggest Gold holders. In their aim to support their currencies in turbulent times, central banks tend to diversify their reserves and buy Gold to improve the perceived strength of the economy and the currency. High Gold reserves can be a source of trust for a country’s solvency. Central banks added 1,136 tonnes of Gold worth around $70 billion to their reserves in 2022, according to data from the World Gold Council. This is the highest yearly purchase since records began. Central banks from emerging economies such as China, India and Turkey are quickly increasing their Gold reserves.
Gold has an inverse correlation with the US Dollar and US Treasuries, which are both major reserve and safe-haven assets. When the Dollar depreciates, Gold tends to rise, enabling investors and central banks to diversify their assets in turbulent times. Gold is also inversely correlated with risk assets. A rally in the stock market tends to weaken Gold price, while sell-offs in riskier markets tend to favor the precious metal.
The price can move due to a wide range of factors. Geopolitical instability or fears of a deep recession can quickly make Gold price escalate due to its safe-haven status. As a yield-less asset, Gold tends to rise with lower interest rates, while higher cost of money usually weighs down on the yellow metal. Still, most moves depend on how the US Dollar (USD) behaves as the asset is priced in dollars (XAU/USD). A strong Dollar tends to keep the price of Gold controlled, whereas a weaker Dollar is likely to push Gold prices up.