


US Dollar Index Price Analysis: DXY retreats from 21-DMA but not out of woods
- US Dollar Index eases from eight-day top, recently bounced off intraday low.
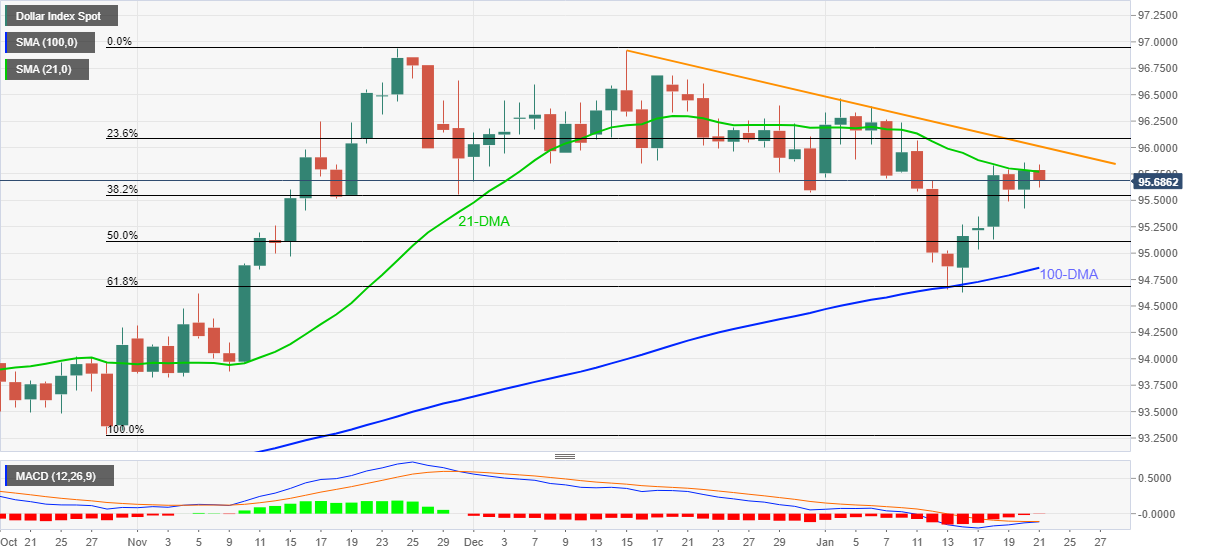
- MACD teases bulls, sustained trading beyond 100-DMA also keeps buyers hopeful.
- Five-week-old descending trend line adds to the upside filters.
US Dollar Index (DXY) pares intraday losses around 95.70, down 0.10% on a day during early Friday.
The greenback gauge has repeatedly failed to cross the 21-DMA so far during the week but the latest MACD conditions tease buyers as the quote remains firmer above the immediate support around 95.50, comprising 38.2% Fibonacci retracement (Fibo.) of October-November upside.
That said, DXY buyers are up for crossing the immediate DMA hurdle surrounding 95.80. However, the quote’s further advances need validation from a descending trend line from December 15, near 96.00.
If the US Dollar Index remains firmer above 96.00, it will witness multiple stops around 96.45-50 before challenging the November 2021 peak of 96.94.
Meanwhile, a clear downside break of 95.50 nearby support will direct the quote towards the 50% Fibo. level of 95.11.
However, the 100-DMA and 61.8% Fibonacci retracement level, respectively around 94.85 and 94.70, will challenge the DXY bears afterward.
DXY: Daily chart
Trend: Pullback expected